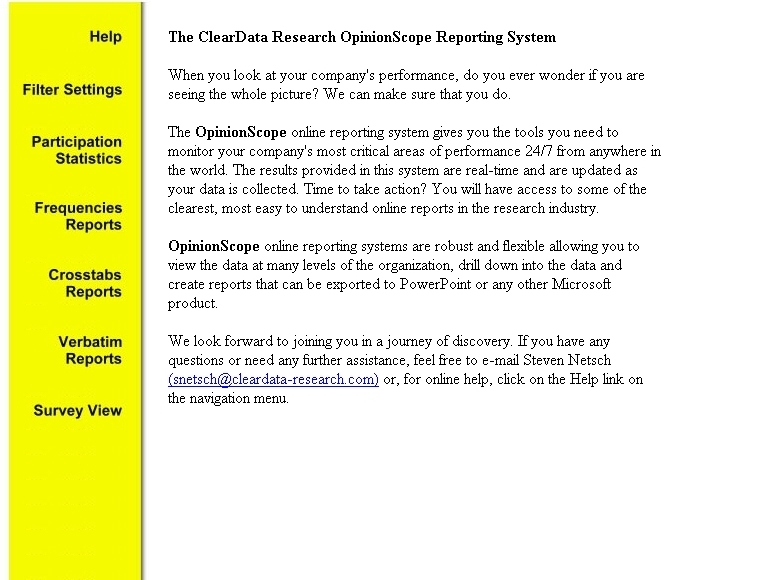
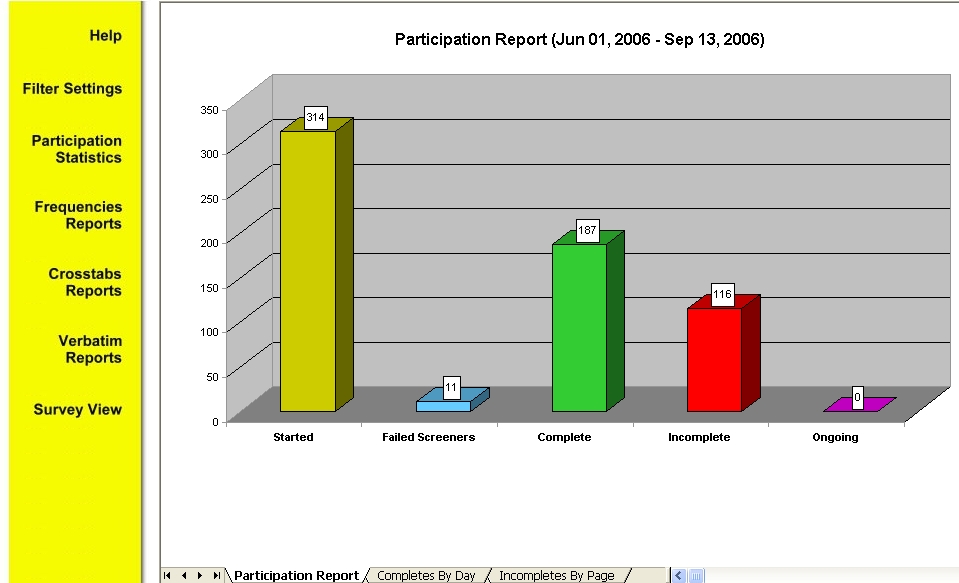
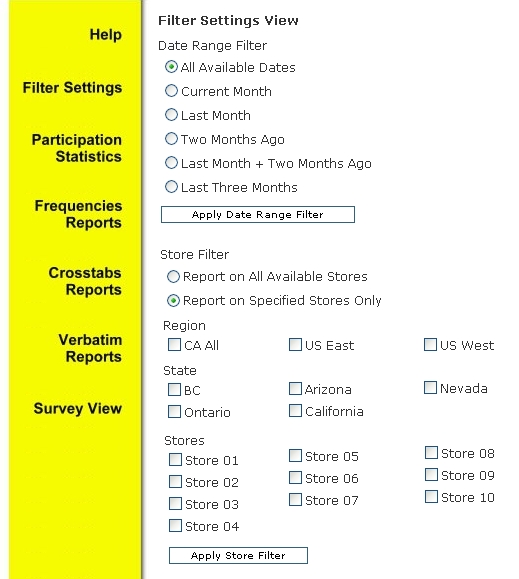
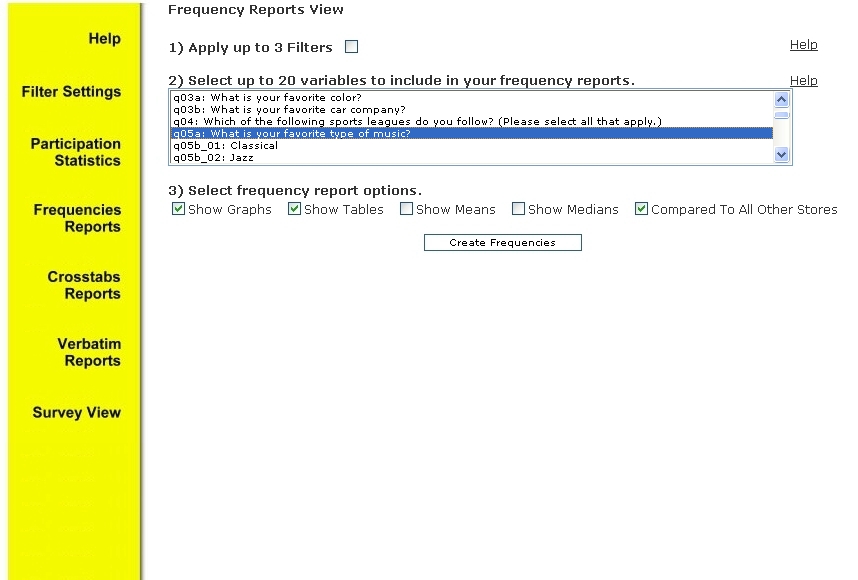
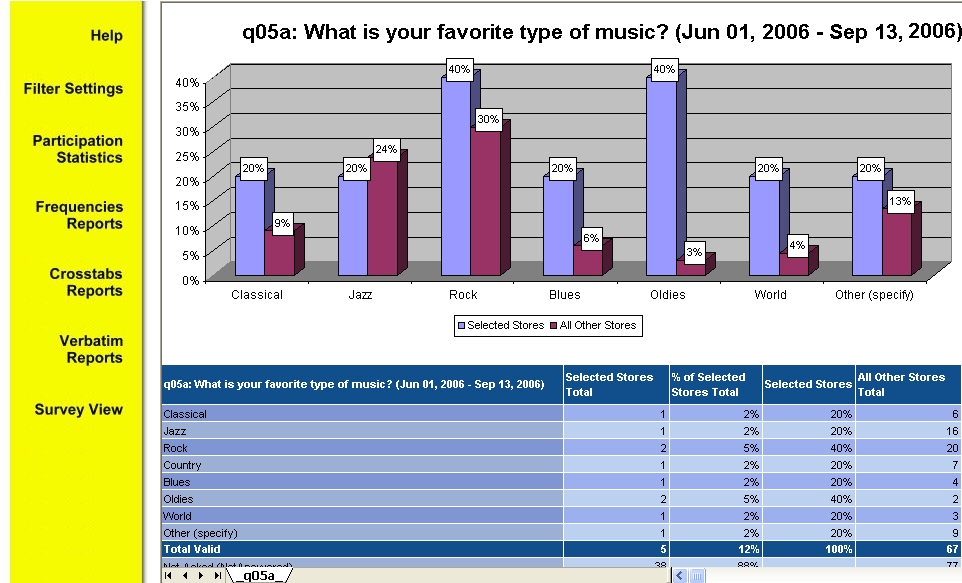
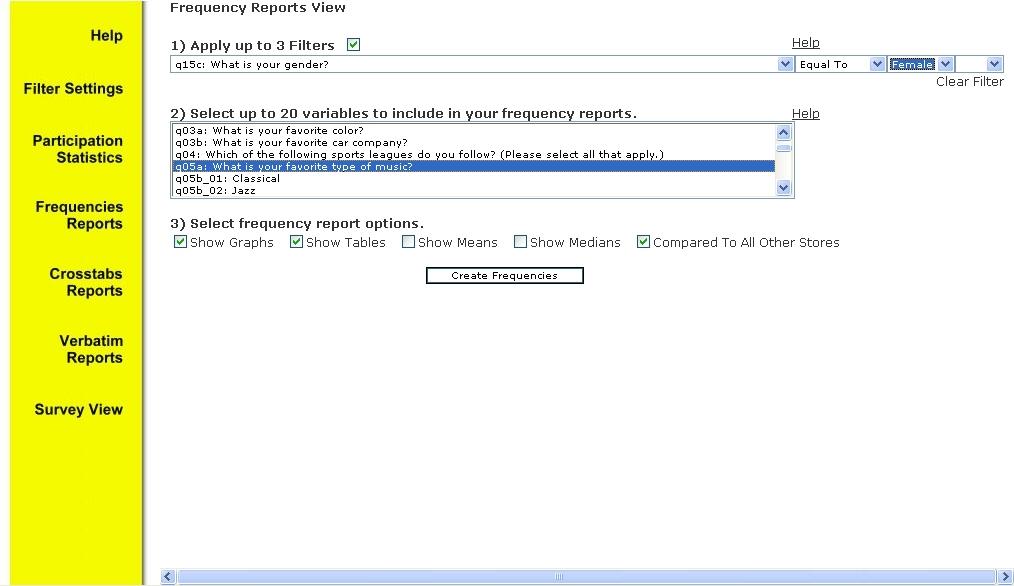
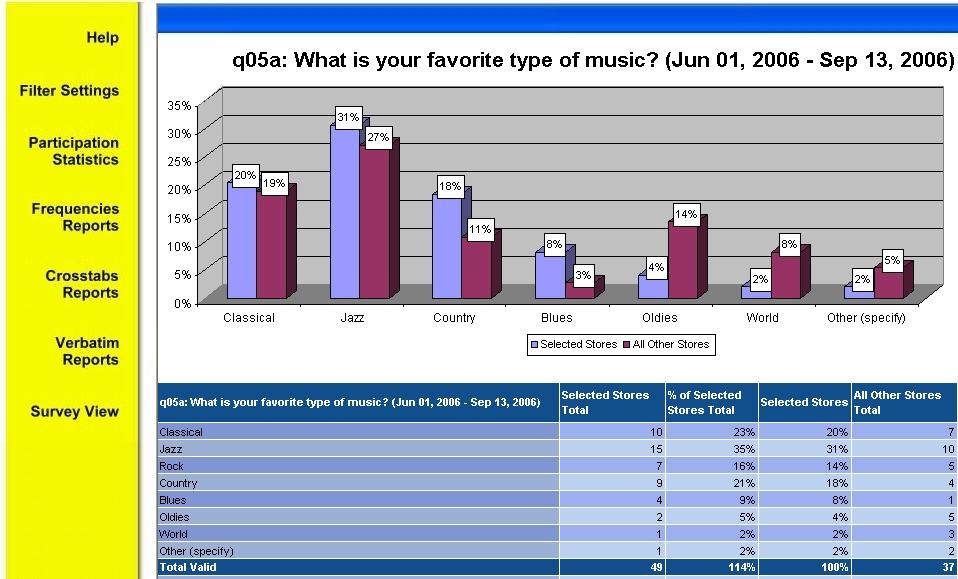
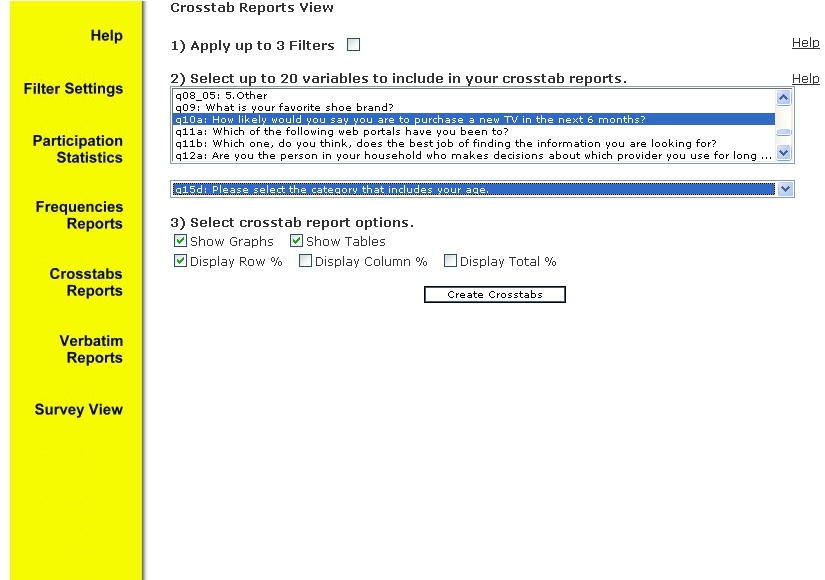
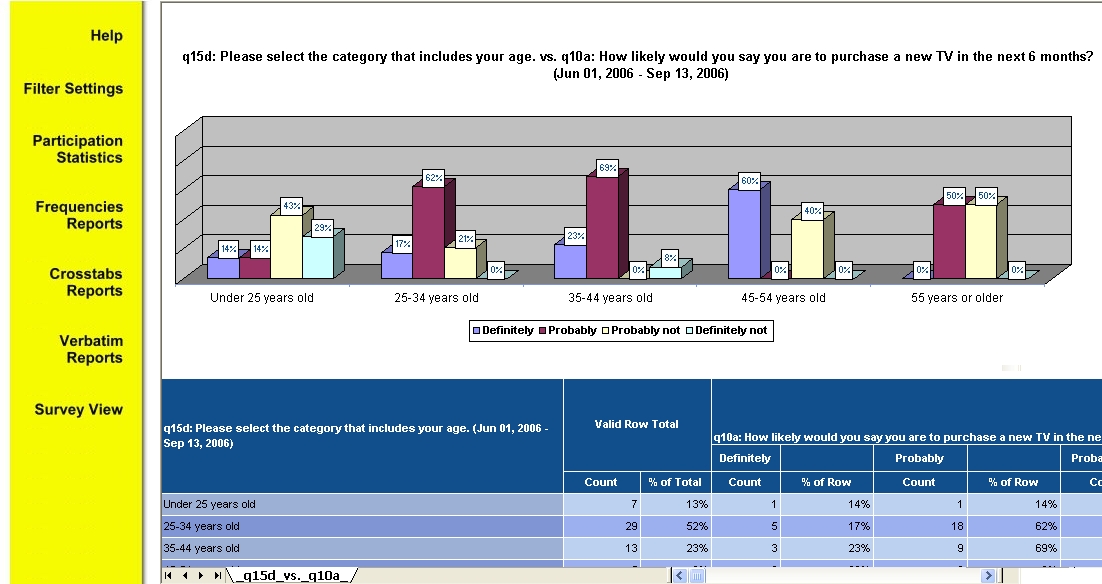
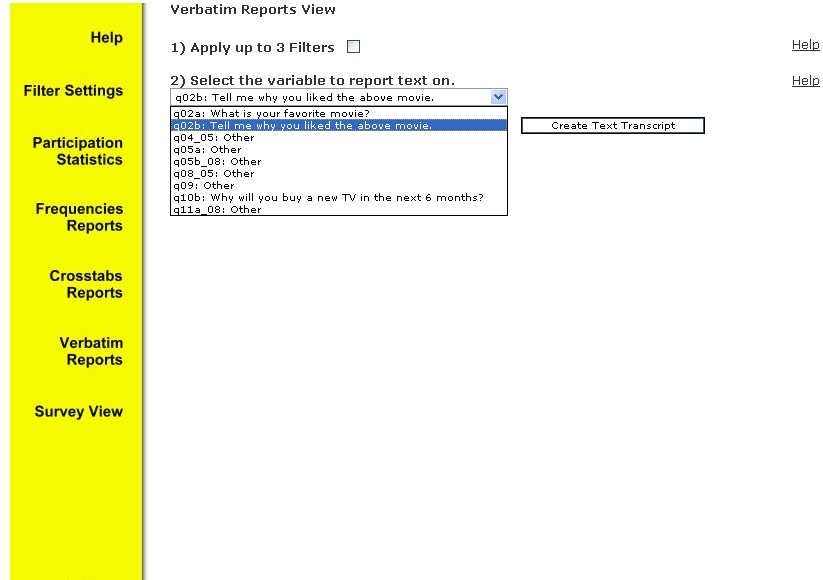
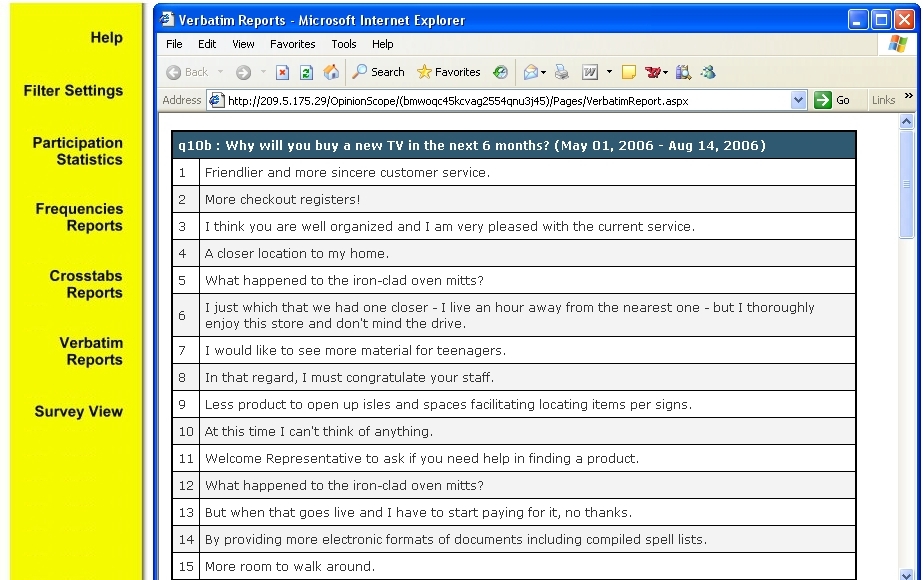
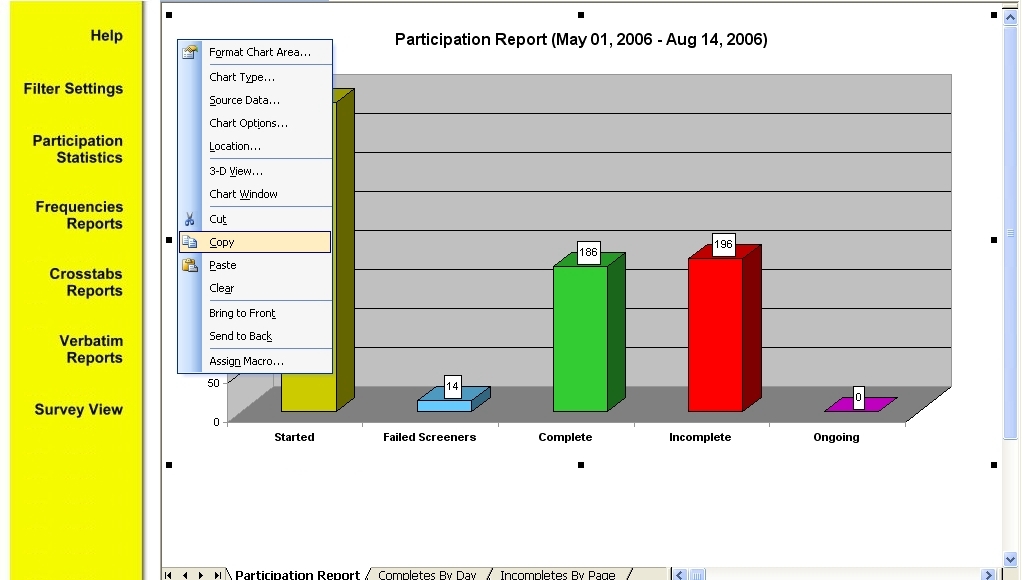
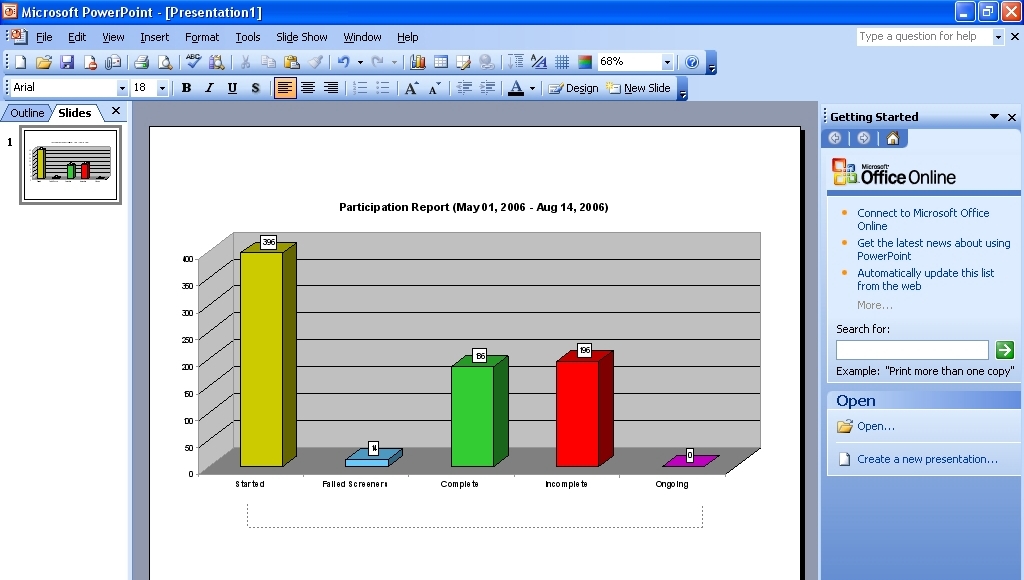
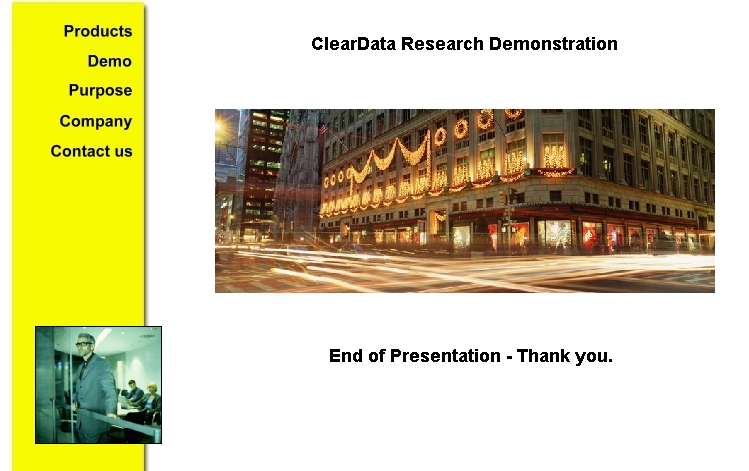
Screen 1: The executive login screen. Screen 2: The reporting desktop; a starting point. Screen 3: Analysis starts. This is an overview of participation in the survey. Screen 4: Primary filter. Filter your data by time period or store. Screen 5: Data overview. Choose the question you would like to analyze. Screen 6: Results overview. "What is your favorite type of music?" Screen 7: Apply a filter by gender = Female. Screen 8: Results overview. Female response to "What is your favorite type of music?" Screen 9: Detailed analysis (crosstabs). Cross purchase behavior by age. Screen 10: Graphing purchase behavior by age group. See the 45-54 year old age band. Screen 11: Select a verbatims report to see customers' responses in their own words. Screen 12: Feedback in your customers' own words. Screen 13: Do you have a presentation to do? Export any graph to Microsoft PowerPoint. Screen 14: Graph exported to Microsoft PowerPoint. Screen 15: End of presentation. Click the ClearData logo to return to home page.